A new use for Google Maps: calculating a city’s carbon footprint
The Environmental Insights Explorer calculates emissions from buildings, car trips, and public transport to illustrate how a city’s sustainability efforts are faring.
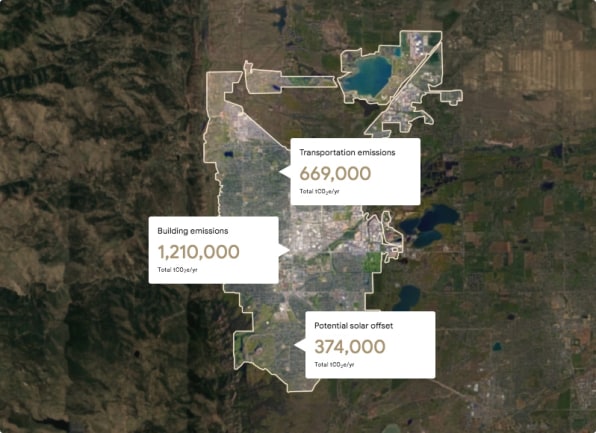
Looking at a city’s Google Maps data, in combination with other data, a new tool from Google can estimate the carbon footprint of all of its buildings–and the carbon footprint of all the car trips, bus and subway rides, and other transportation used by the people living there.
The Environmental Insights Explorer, an online tool that launched in beta on September 10 and is still in development, is designed to help cities deal with the first step of a plan to reduce emissions: knowing what their current carbon footprint is. More than 9,000 cities have already committed to cut emissions in line with the goals of the Paris Agreement, but more than a third of those cities haven’t yet built an inventory of emissions. The process can take months or even years, and cost hundreds of thousands of dollars, making it particularly challenging for smaller cities.
The new tool, which Google created along with the Global Covenant of Mayors for Climate and Energy, can help cities calculate a large chunk of those emissions at no cost. “This is looking at the thousands of cities that are out there today that don’t typically have the resources to spend on digging up the data or analyzing the data,” says Nicole Lombardo, who leads partnerships for Google’s environmental insights team, which is creating the tool. “This tool helps to do some of that and reduce some of the complexities and the cost in that process, so you have more people spending less time data gathering and data crunching and more on the action planning.”
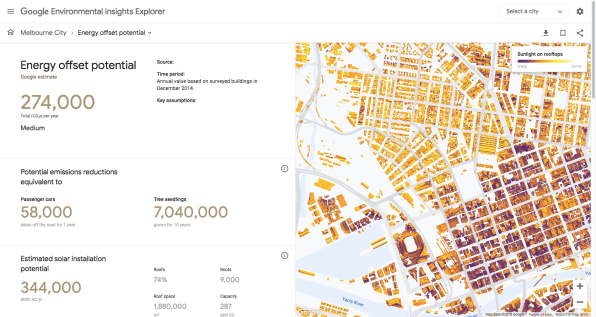
Using Google Maps data, the tool can infer whether buildings are homes or businesses, and then can use the estimated size of each building and data about the regional grid to estimate both how much energy the buildings use and the emissions of that energy use. Using location data from Google Maps, the tool can infer traffic and modes of travel, and then estimate the emissions from that transportation.
Cities can go deeper into the tool to adjust the data to estimate how the footprint would change if the amount of housing grew, for example, or if the city added a new subway line. The tool also pulls in Google’s Project Sunroof, which uses AI to analyze satellite images to determine which roofs are well suited for solar power, so cities can consider solar power as they begin to plan how to cut emissions.
Because Environmental Insights Explorer is in beta now, it’s only possible to see the analysis for a handful of cities. The team is now working with cities to refine the design and ensure the accuracy of the data. But it ultimately wants to offer the tool wherever it has available data. “The beauty is we’re sitting on a massive data set that is standardized and able to scale,” says Lombardo.
—
Original article on Fast Company: https://www.fastcompany.com/90233731/a-new-use-for-google-maps-calculating-a-citys-carbon-footprint
Global Covenant of Mayors Announces Commitment to Build City Research and Innovation AgendaMarch 22, 2018
Page Navigation
We care about your privacy
The Global Covenant of Mayors for Climate and Energy uses some
necessary cookies which
are required for our website to function. By
accepting all cookies
you consent to the use of additional cookies to analyze site traffic and online behavior.
You can manage cookies
or withdraw your consent at any time.
This does not affect the lawfulness of the use of these cookies prior to withdrawal.
For more information read our
Cookie Policy.
These cookies are necessary for the website to function and cannot be switched off in our
systems.
They are usually only set in response to actions made by you which amount to a request for
services,
such as setting your privacy preferences, logging in or filling in forms. You can set your
browser
to block or alert you about these cookies, but some parts of the site will not then work. These
cookies do not store any personally identifiable information.
These cookies are necessary for the website to function and cannot be switched off in our
systems. They are usually only set in response to actions made by you which amount to a request
for services, such as setting your privacy preferences, logging in or filling in forms. You can
set your browser to block or alert you about these cookies, but some parts of the site will not
then work. These cookies do not store any personally identifiable information.
These cookies allow us to count visits and traffic sources, so we can measure and improve the
performance of our site. They help us know which pages are the most and least popular and see
how visitors move around the site. All information these cookies collect is aggregated and
therefore
anonymous. If you do not allow these cookies, we will not know when you have visited our site.
Cookie
Provider
Type
Duration
Description
_pk_id
Matomo Analytics
13 months
Used to store a few details about the user such as the
unique visitor ID
_pk_ses
Matomo Analytics
30 minutes
Short lived cookies used to temporarily store data for
the visit
viewed_cookie_policy
www.globalcovenantofmayors.org
persistent
6 months
Used to note whether you have viewed the cookie policy